Search Results
Results for: '4'

1A Ch12.4A2 Broken lines graph
By: t1917, Views: 628
Statistical diagrams representing two different sets of data 2
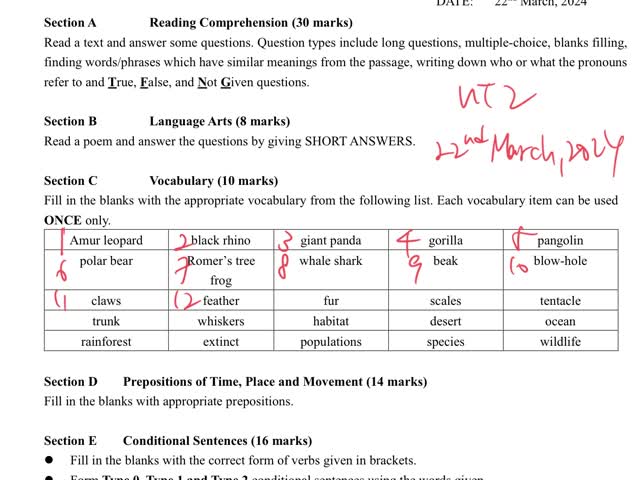
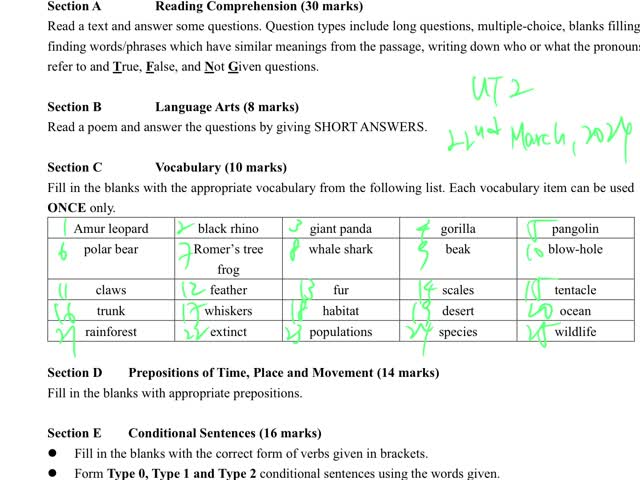
2324_UT2_F2_Paper 2A_Student Outline_Vocab_Part A
By: t1602, Views: 450
2324_UT2_F2_Paper 2A_Student Outline_Vocab_Part A
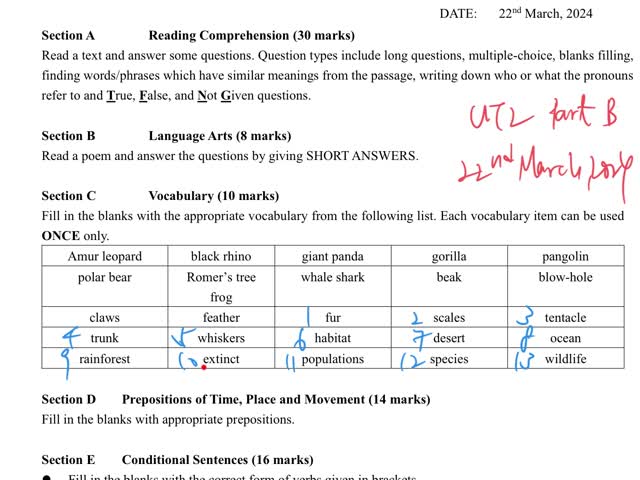
2324_UT2_F2_Paper 2A_Student Outline_Vocab_Part B
By: t1602, Views: 444
2324_UT2_F2_Paper 2A_Student Outline_Vocab_Part B
2324_UT2_F2_Paper 2A_Student Outline_Vocab_All
By: t1602, Views: 529
2324_UT2_F2_Paper 2A_Student Outline_Vocab_All
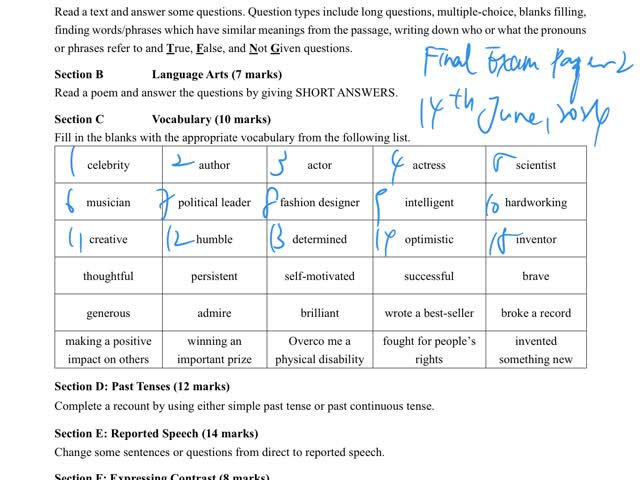
2324_X2_F2_Paper 2A_Student Outline_Vocab_Part A
By: t1602, Views: 417
2324_X2_F2_Paper 2A_Student Outline_Vocab_Part A
2324_X2_F2_Paper 2A_Student Outline_Vocab_Part B
By: t1602, Views: 381
2324_X2_F2_Paper 2A_Student Outline_Vocab_Part B
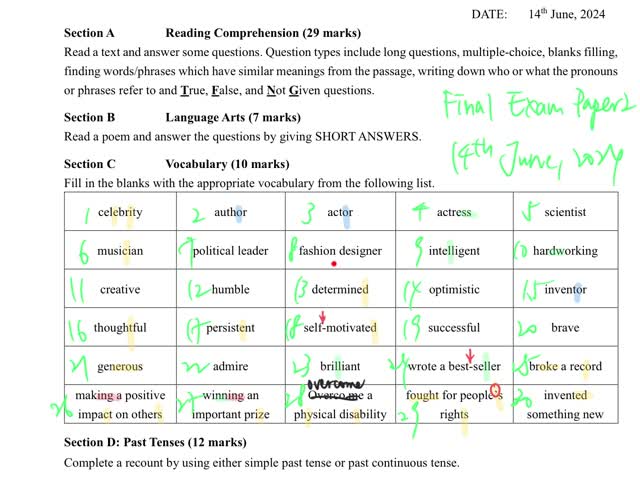
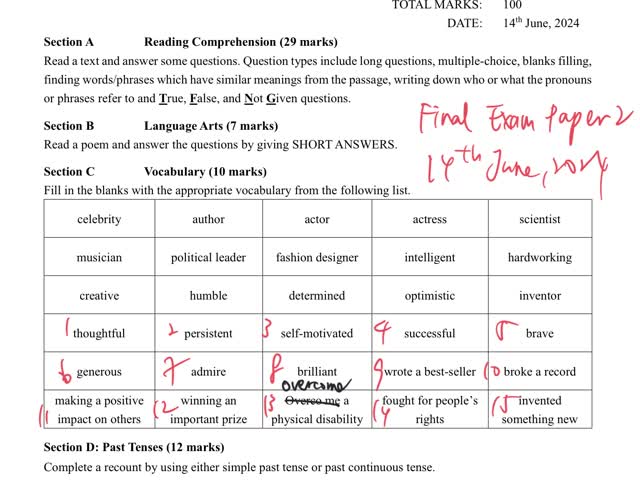
2324_X2_F2_Paper 2A_Student Outline_Vocab_All
By: t1602, Views: 459
2324_X2_F2_Paper 2A_Student Outline_Vocab_All
YU CHUN KEUNG MEMORIAL COLLEGE