Search Results
Results for: '4'
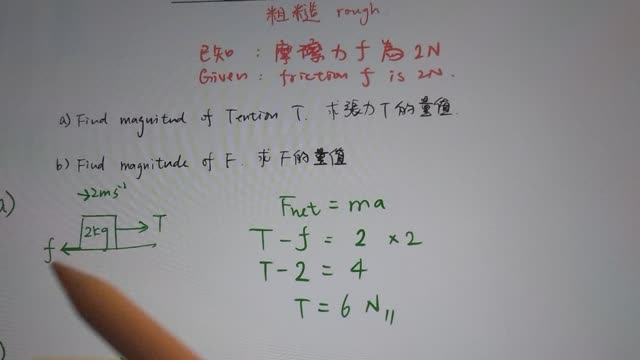
WS17_3.4_Two objects_Horizontal plane_Rough surface
By: t2208, Views: 1008
Two objects_Horizontal plane_rough surface
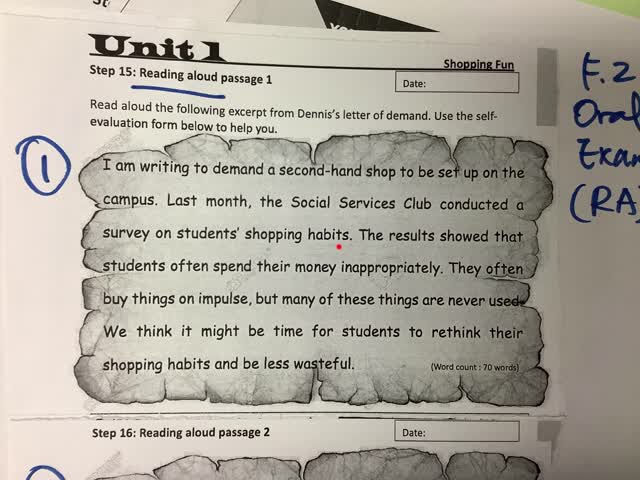
F2 oral reading aloud 1 2324 first term exam
By: t0721, Views: 740
F2 oral reading aloud 1 2324 first term exam
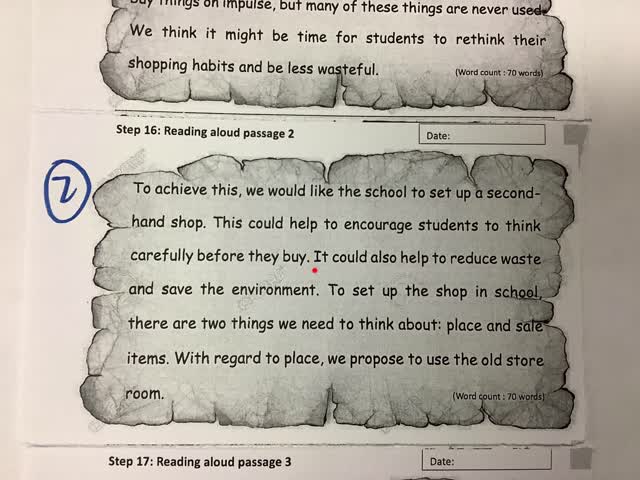
F2 oral reading aloud 2 2324 first term exam
By: t0721, Views: 730
F2 oral reading aloud 2 2324 first term exam
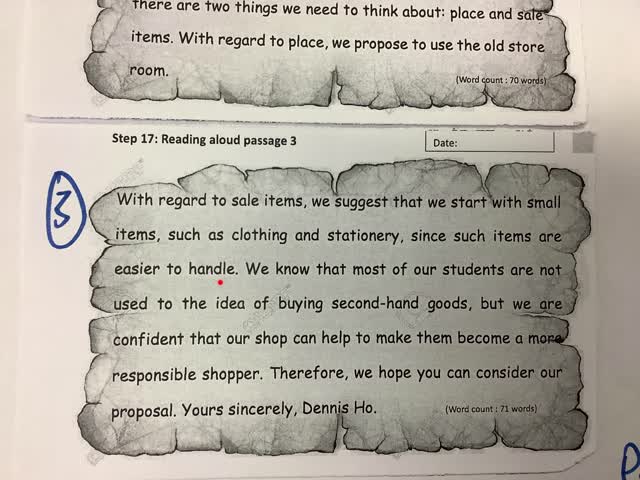
F2 oral reading aloud 3 2324 first term exam
By: t0721, Views: 761
F2 oral reading aloud 3 2324 first term exam
YU CHUN KEUNG MEMORIAL COLLEGE