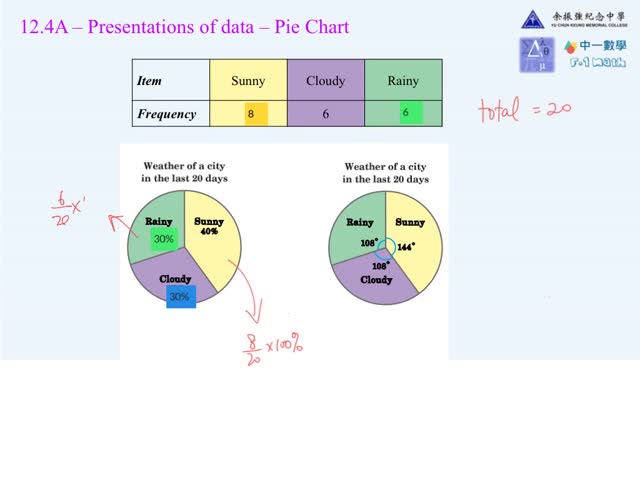
414
0 0
By: t1917
Date Uploaded: 05/17/2024
Tags: S1 math
Statistical diagrams representing two different sets of data 2
Share
Embed
Copy and paste this code into your website or blog.
Add To
You must login to add videos to your playlists.
Comments
0 Comments total
Sign In or Register to post comments.
No comments have been posted for this video yet.
YU CHUN KEUNG MEMORIAL COLLEGE
 
Suggestions
1A Ch12.4A1 Bar chart and broken line graph
Views: 418
F.1 Math 12.4AB Pie chart, broken line graph
By: t1117
Views: 1164
4S Math - 14.2 - angles, lines in 3-D (Q1)
Views: 1746
4S Math - 14.2 - angles,lines in 3-D (DSE Eng)
Views: 1939
4S Math - 14.2 - angles, lines in 3-D (Q2)
Views: 1952
4S Math - 14.2 - angles,lines in 3-D (DSE中)
Views: 1869
4S Math - 1.1F Special lines
Views: 2098
S5 Math Ch12.2 Effects of Changing Data on Dispersion
Views: 1624
S5 Math Ch12.1A-C Worksheets Tips
Views: 1417
Comments
0 Comments total
Sign In or Register to post comments.
No comments have been posted for this video yet.