Search Results
Results for: '4X1_BIO_Ch.9_interpretation to the graph about gaseous exchange in plants_13'
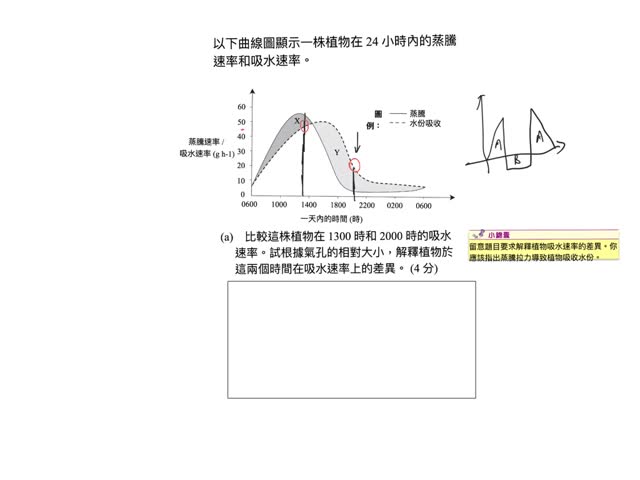
4X1_BIO_Ch.10_transpiration VS absorption Q1a_16
By: t1909, Views: 1119
4X1_BIO_Ch.10_transpiration VS absorption Q1_16
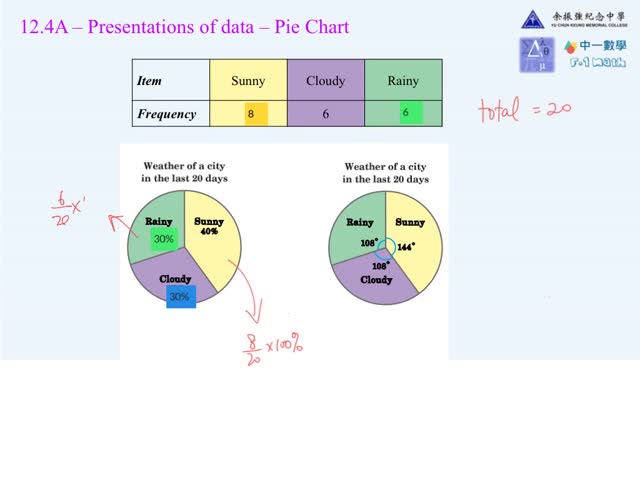
F.1 Math 12.4AB Pie chart, broken line graph
By: t1117, Views: 1456
F.1 Math 12.4AB Pie chart, broken line graph

1A Ch12.4A2 Broken lines graph
By: t1917, Views: 604
Statistical diagrams representing two different sets of data 2

1A Ch12.4A1 Bar chart and broken line graph
By: t1917, Views: 581
Statistical diagrams representing two different sets of data 1
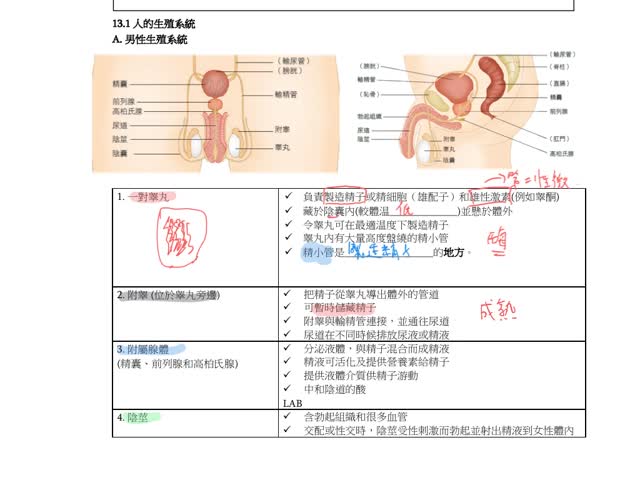
4X1_BIO_Ch.13_Human reproductive system_1
By: t1909, Views: 1136
4X1_BIO_Ch.13_Human reproductive system_1
YU CHUN KEUNG MEMORIAL COLLEGE