Search Results
Results for: '4X1_BIO_Ch.9_exercise about graph (gaseous exchange in plants)_16_E'
4S Maths Topic 12 Graph of Functions_11
By: t1110, Views: 657
4S Maths Topic 12 Graph of Functions_11
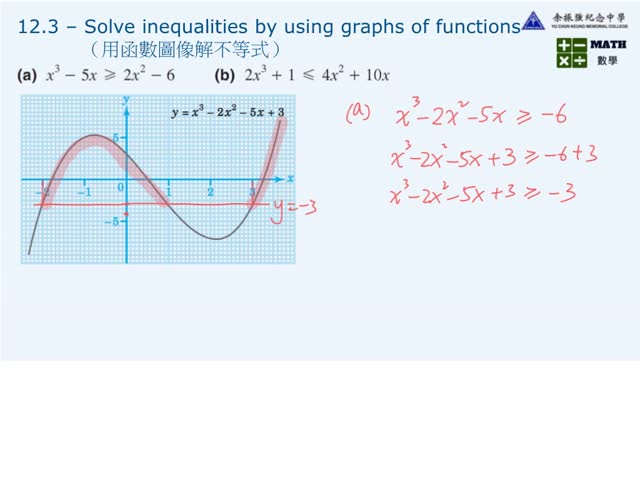
4S Math - 12.3 - Solve inequalities by using graph of function(用函數圖像解不等式)
By: t1117, Views: 2134
12.3 - Solve inequalities by using graph of function(用函數圖像解不等式)
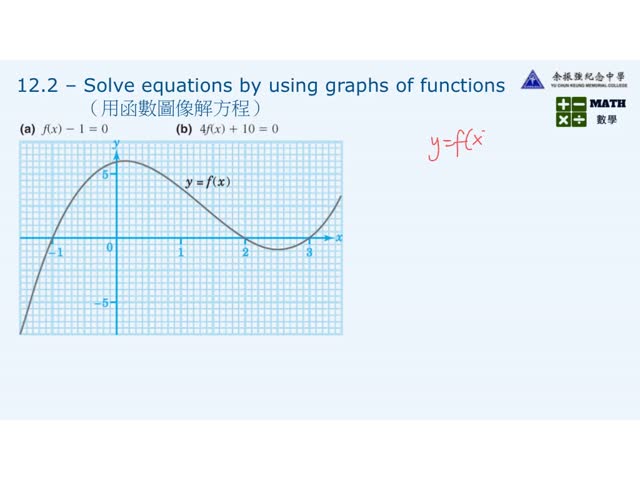
4S Math - 12.2 - Solve equations by using graph of function(用函數圖像解方程)
By: t1117, Views: 2128
12.2 - Solve equations by using graph of function(用函數圖像解方程)
F.4_Ch.7_Exponential Function_case 1: a>1
By: t2402, Views: 256
Illustrate the graph f(x) = a^x, where a > 1.
F.4_Ch.7_Exponential Function_case 1: a>1
By: t2402, Views: 281
illustrate the graph f(x)= a^x, where a>1
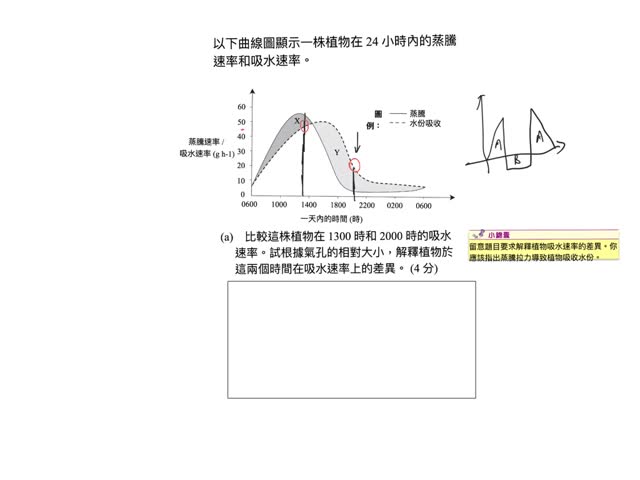
4X1_BIO_Ch.10_transpiration VS absorption Q1a_16
By: t1909, Views: 983
4X1_BIO_Ch.10_transpiration VS absorption Q1_16
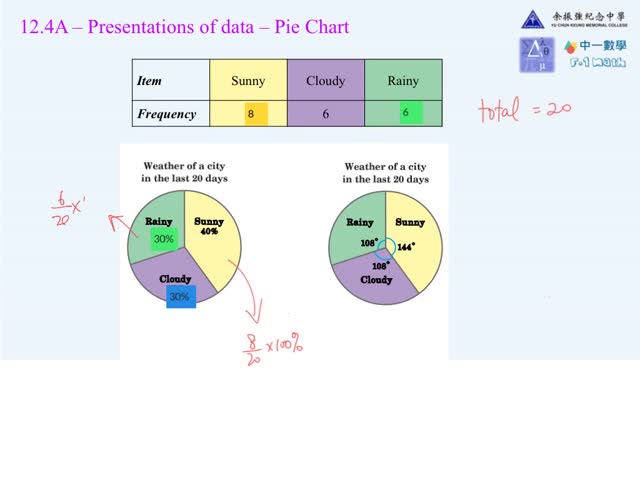
F.1 Math 12.4AB Pie chart, broken line graph
By: t1117, Views: 1250
F.1 Math 12.4AB Pie chart, broken line graph
1A Ch12.4A2 Broken lines graph
By: t1917, Views: 462
Statistical diagrams representing two different sets of data 2
YU CHUN KEUNG MEMORIAL COLLEGE

