Search Results
Results for: 'F2 Math 8.3.D: Inverse Proportions Food'
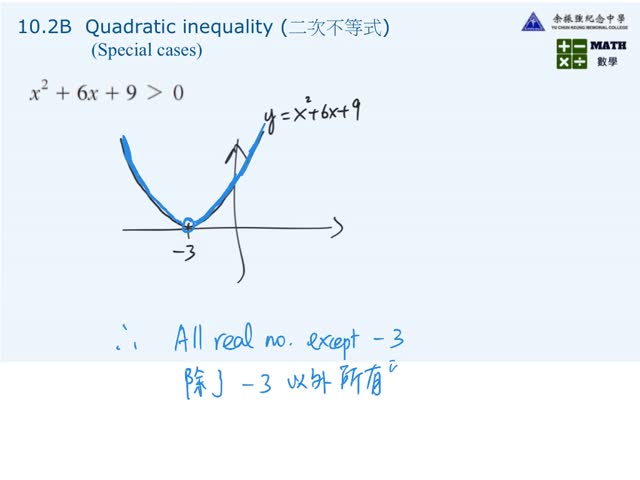
4S Math - 10.2B - quadratic inequality graphically 二元一次圖解法(Special cases)
By: t1117, Views: 2197
10.2B - quadratic inequality graphically 二元一次圖解法(Special cases)
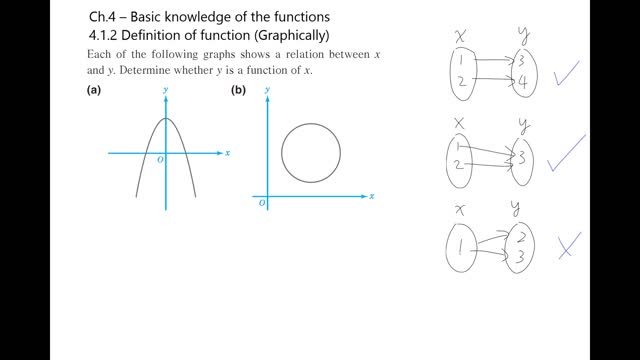
Math-Ch.4.1.2 Definition of function (Graphically)
By: t1117, Views: 1510
4.1.2 Definition of function (Graphically)
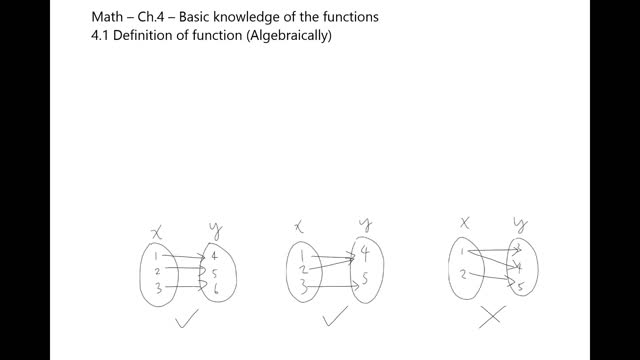
Math-Ch.4.1.1 Definition of function (Algebraically)
By: t1117, Views: 1825
4.1.1 Definition of function (Algebraically)

1A Ch12.4A2 Broken lines graph
By: t1917, Views: 628
Statistical diagrams representing two different sets of data 2

1A Ch12.4A1 Bar chart and broken line graph
By: t1917, Views: 620
Statistical diagrams representing two different sets of data 1
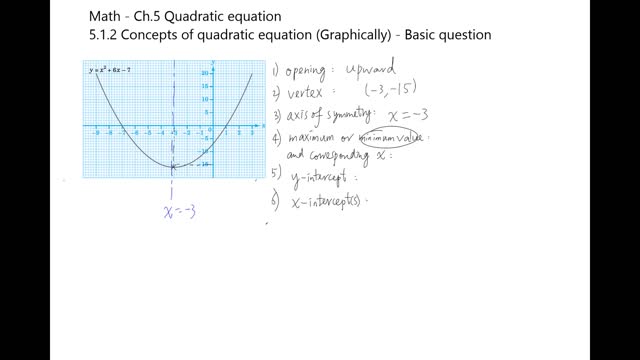
Math - Ch.5.1.2 Concepts of quadratic function (Graphically) - Basic question
By: t1117, Views: 1677
5.1.2 Concepts of quadratic function (Graphically) - Basic question
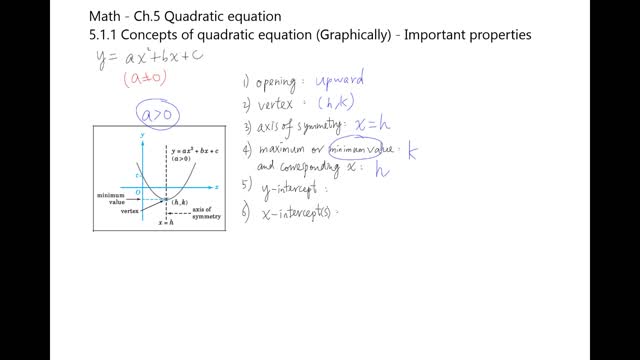
Math - Ch.5.1.1 Concepts of quadratic equation (Graphically) - Important properties
By: t1117, Views: 1725
5.1.1 Concepts of quadratic equation (Graphically) - Important properties
YU CHUN KEUNG MEMORIAL COLLEGE