Results for: 'n'
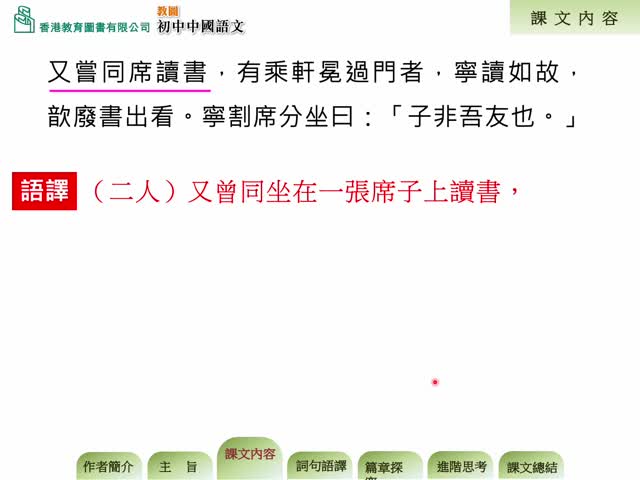
F2 Chinese 世說新語 管寧 華歆園中鋤菜
By: t1005, Views: 990
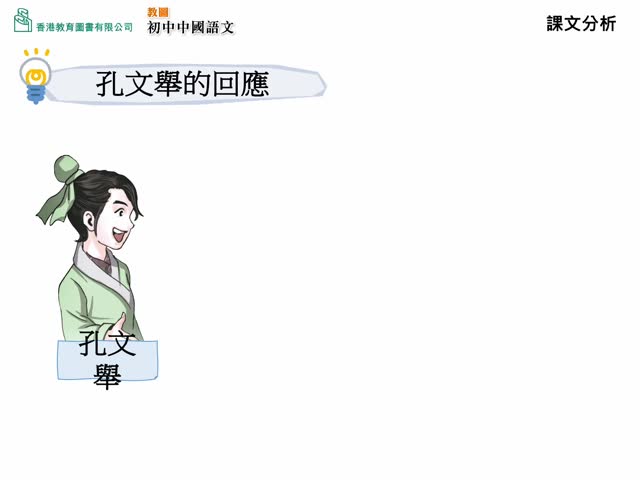
F2 Chinese 世說新語 小時了了
By: t1005, Views: 959
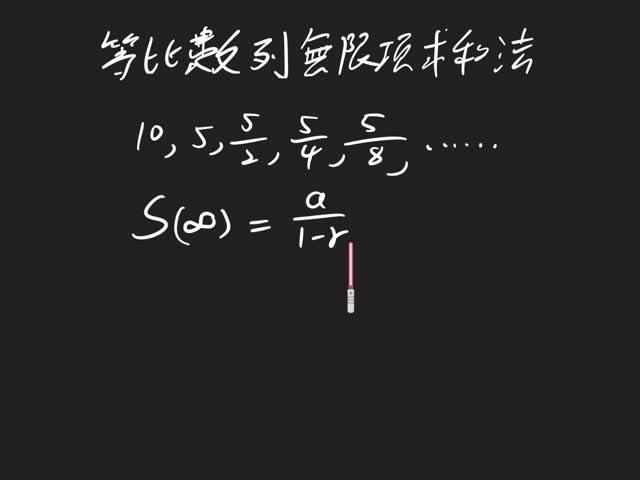
等比數列無限項之和 Sn 2 Maths. F.6
By: t2301, Views: 509
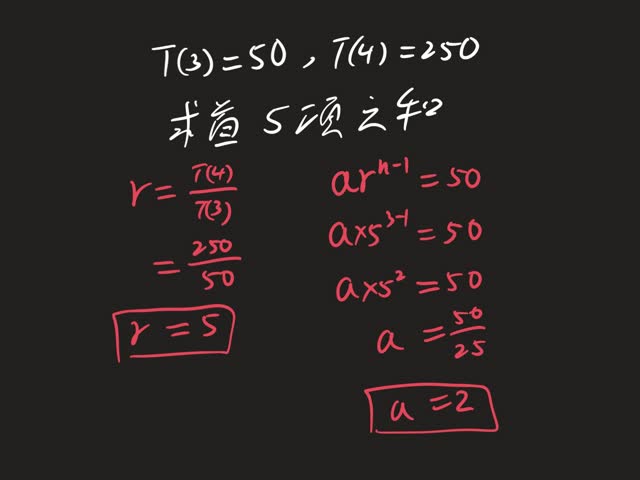
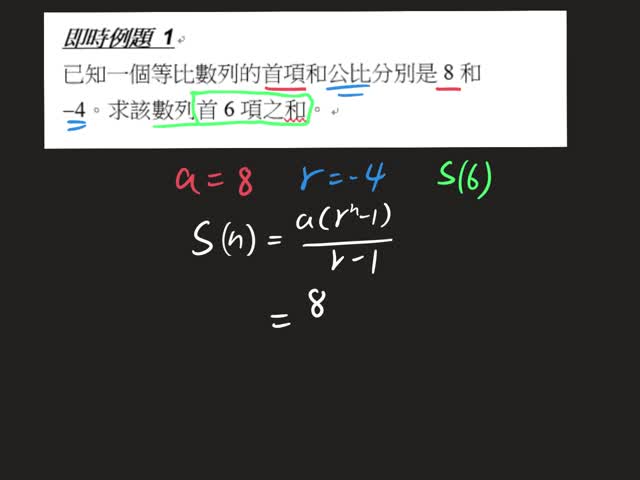
等比數列求和法 有限項 s(n) 1 Maths. F.6
By: t2301, Views: 514
等比數列求和法 1 S(n) Maths. F.6
By: t2301, Views: 499
Change of variables
By: t2208, Views: 738
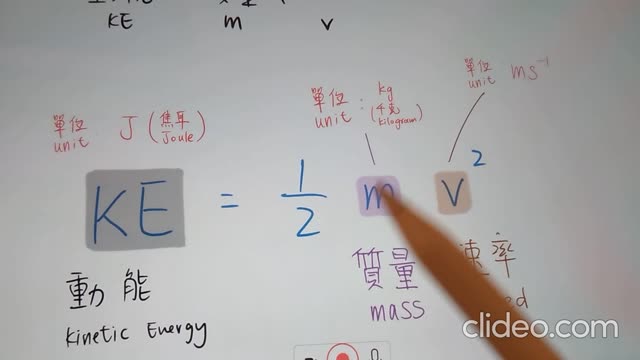
KE
Meaning of KE
By: t2208, Views: 629
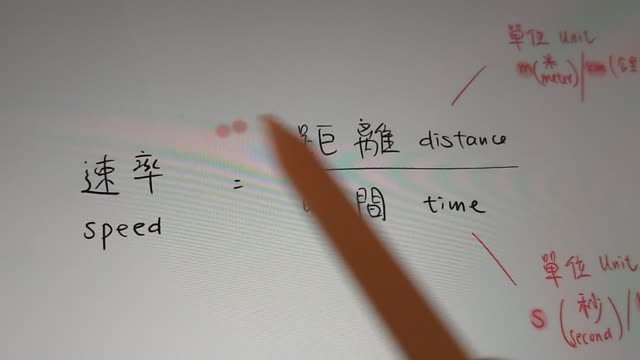
s=vt
By: t2208, Views: 682
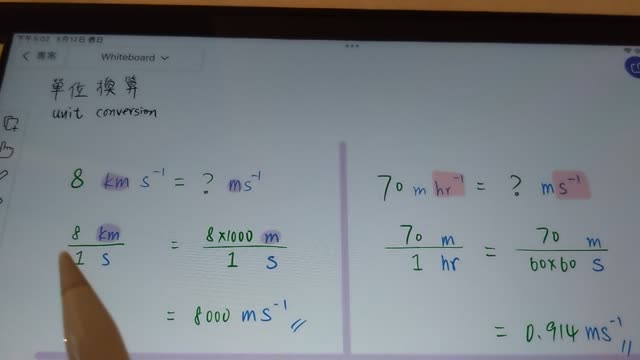
unit conversion
By: t2208, Views: 680
YU CHUN KEUNG MEMORIAL COLLEGE