Results for: 'L'
Fujitsu Smart TV Simple Gudie
By: admin, Views: 466
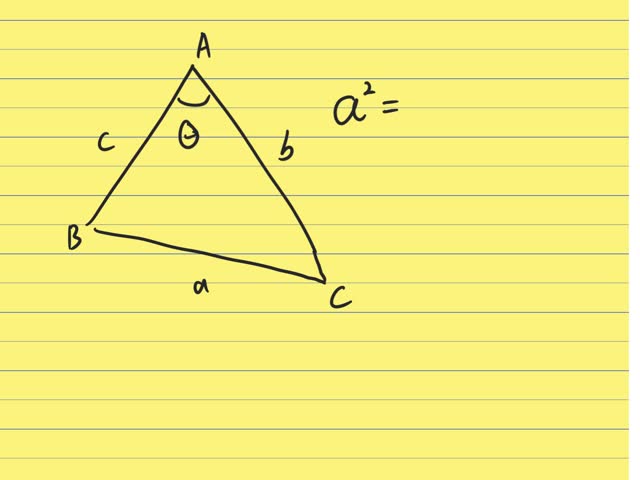
Cosine law
By: t2301, Views: 479
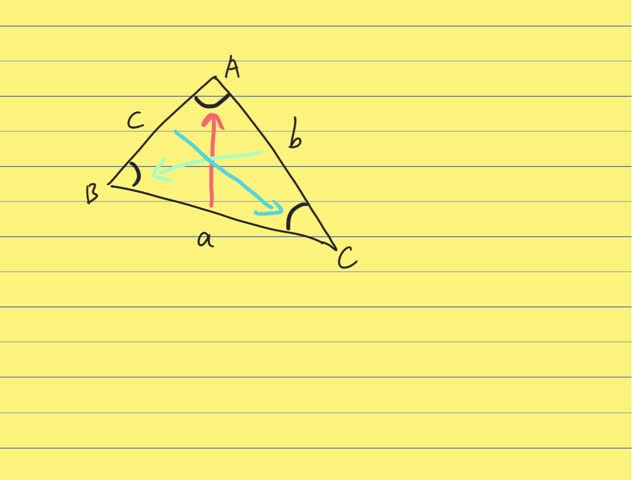
sine law
By: t2301, Views: 467
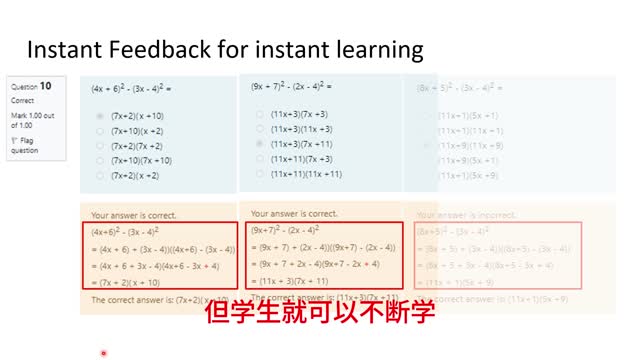
3. moodle (數學) 學生預習
By: yhh, Views: 683
moodle (數學) 學生預習
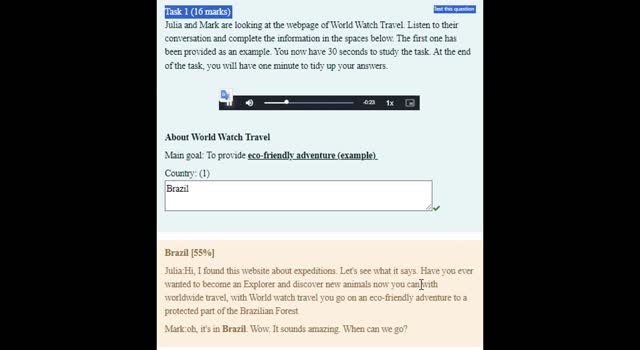
moodle 英文科例子
By: yhh, Views: 648
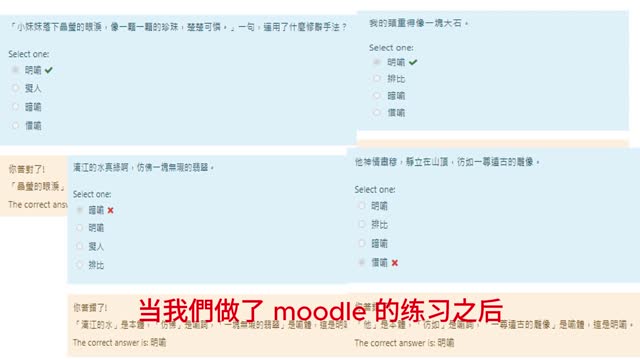
5. moodle (中文)
By: yhh, Views: 1918
moodle (中文)
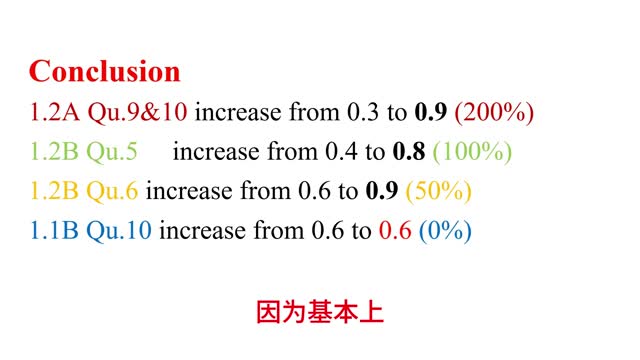
4. moodle (數學)協助老師了解學生
By: yhh, Views: 748
moodle (數學)協助老師了解學生
Change of variables
By: t2208, Views: 740
KE
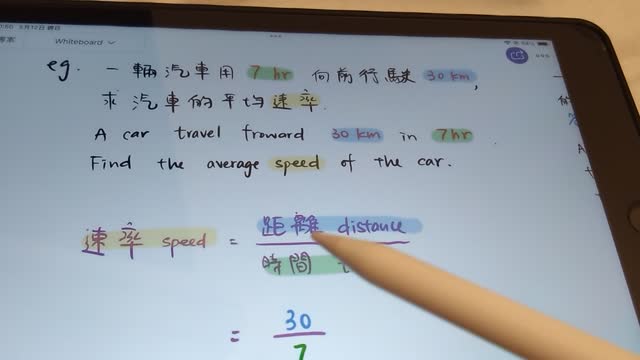
motion - example
By: t2208, Views: 769
s=vt
YU CHUN KEUNG MEMORIAL COLLEGE